


Your skills dashboard probably looks impressive. Training completion trending up. Certifications increasing quarter-over-quarter. Assessment scores holding steady above target thresholds. Meanwhile, product launches keep slipping, customer issues take longer to resolve, and that critical technical project can't find the right talent internally — even though your dashboard shows plenty of "qualified" people.
The disconnect happens because HR inherited metrics from learning management systems built to track training compliance, not business impact. These systems measure what's convenient to capture: course completions, test scores, manager ratings. They miss what actually matters — whether someone can ship production code, resolve customer escalations, or optimize supply chain bottlenecks under real pressure.
The pattern across companies dealing with this exact problem is depressingly consistent. Organizations pour millions into talent development while measuring everything except whether those investments actually improve business outcomes. They track activity, not capability. They measure potential, not performance.
The $2.3M mistake that revealed why skill metrics fail
A logistics company's skills dashboard painted a rosy picture. Their warehouse staff showed 87% proficiency in inventory management systems. Forklift certifications were current. Safety training completion sat at 96%.
Then they rolled out a new warehouse management system.
Order fulfillment accuracy dropped from 99.2% to 94.1% in three weeks. Shipping delays jumped 40%. Customer complaints flooded in. The implementation that should have taken 6 weeks stretched to 4 months.
The investigation revealed an uncomfortable truth: those impressive skill metrics measured theoretical knowledge from classroom training. Nobody tracked whether workers could actually operate the systems under warehouse conditions — with time pressure, incomplete information, and constant interruptions. The dashboard showed green while operations burned red.
This wasn't really a training failure. Workers knew the material. They could pass the tests. But knowing and doing are different skills, and the dashboard only measured knowing.
Most organizations discover this gap the hard way — through failed projects, missed targets, or customer defections. By then, the damage is done.
Why traditional dashboards create false confidence
Skills measurement typically follows a predictable path toward dysfunction. HR starts with good intentions: let's track employee capabilities to make better talent decisions. They implement assessments, build dashboards, celebrate early wins when metrics trend upward.
Stop losing track of critical skills.
Talioly helps you track, develop, and certify your workforce efficiently.
- Centralized skill profiles
- Automated training reminders
- Competency gap analysis
No credit card required
But the foundation is wrong from the start.
Assessment-based measurement assumes people accurately evaluate their own abilities, or that managers can objectively rate their teams. Both assumptions fall apart quickly. Research on software developers found that self-reported skill levels had almost zero correlation with actual code quality metrics. The worst performers consistently rated themselves highest.
Training-based metrics assume completion equals competence. A senior analyst at a financial firm completed advanced Excel training with a 94% score. Three months later, she was still manually calculating formulas that could have been automated with basic pivot tables. The training worked. The transfer to daily work didn't.
Certification-focused tracking assumes credentials predict performance. A manufacturing plant required Six Sigma certification for all quality engineers. Defect rates stayed flat for two years despite 100% certification. The certifications proved people could memorize methodologies — not that they could identify defect patterns in actual production data.
The aggregation problem makes everything worse. When you average skill scores across teams or departments, critical gaps disappear into statistical noise. "Marketing has 78% digital skills coverage" means nothing if your campaign automation specialist — the one person who actually runs campaigns — lacks the specific skills to use your marketing platform effectively.
Building KPIs that connect skills to business outcomes
Real measurement starts where traditional metrics end: with actual business results.
Instead of asking "What percentage of employees completed customer service training?" ask "How do resolution times correlate with specific service capabilities?"
Instead of tracking "Number of certified project managers," measure "Project success rates by PM skill composition."
Instead of celebrating "Learning hours per employee," analyze "Revenue per employee by skill portfolio."
This shift requires mapping skills to operational workflows, not organizational charts. A retail chain discovered their point-of-sale system skills didn't live in the IT department — they were scattered across floor managers who had figured out workarounds for common problems. Their skills dashboard completely missed this because it only tracked formal IT training.
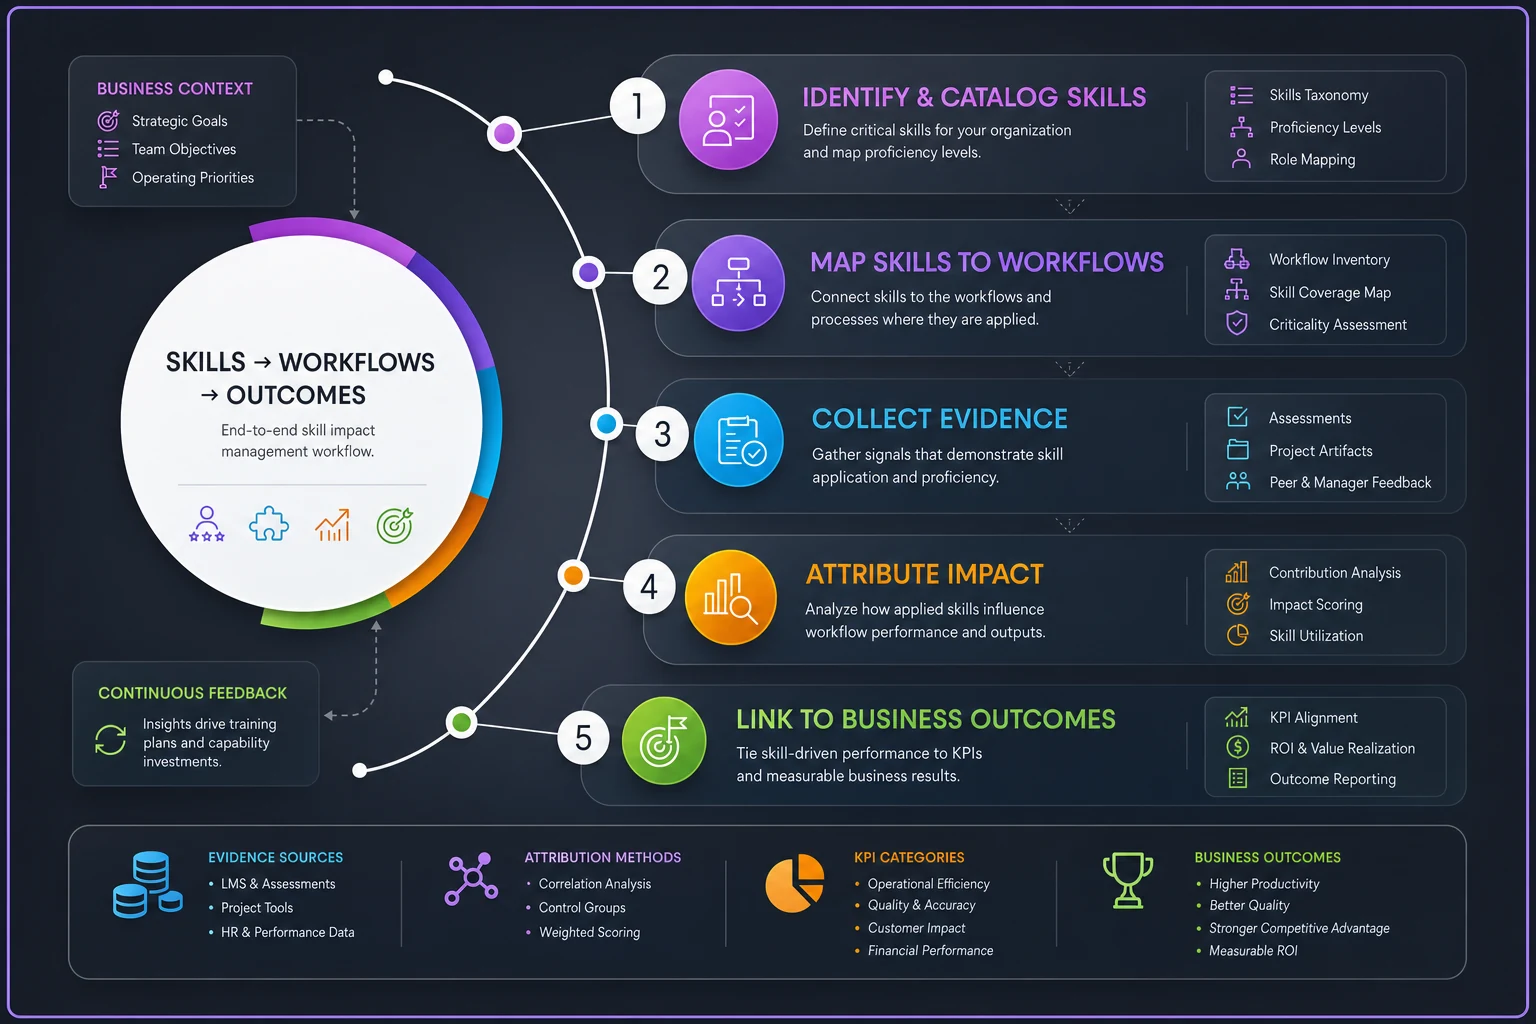
The mapping process revealed surprising connections. Customer satisfaction scores correlated more strongly with employees' ability to navigate internal knowledge bases than with communication training. Product quality improved more from cross-functional collaboration skills than from technical certifications. Speed-to-market depended more on decision-making frameworks than on project management methodologies.
Once you identify these connections, the KPIs practically design themselves. Each business outcome gets linked to contributing capabilities through measurable operational evidence.
The complete KPI library for skills that matter
Revenue Generation Capabilities
Sales Performance Indicators:
-
Average deal size by product knowledge depth (not certification status)
-
Customer lifetime value by account manager relationship skills
-
Upsell success rate correlated to needs analysis capabilities
-
Proposal win rate by industry expertise level
-
Time-to-quota for new hires by onboarding skill development speed
Track these through CRM data, not training records. Look at actual deals closed, real customer interactions, documented upsells — not course completions or role-play scores.
Product Development Velocity:
-
Feature cycle time by team technical skill mix
-
Production bug rate per developer skill profile
-
Architecture debt accumulation by system design capability
-
Code review turnaround by reviewer expertise
-
Deploy frequency correlated to DevOps proficiency
Pull this data from your development tools — Jira, GitHub, deployment pipelines. The evidence lives in commit histories and production logs, not in certification databases.
Cost Reduction Through Capability
Operational Efficiency Metrics:
-
Error rates by operator skill verification method
-
Rework hours linked to specific skill gaps
-
Automation adoption success by technical readiness
-
Incident resolution time by available expertise
-
Resource allocation efficiency by skill-matching accuracy
Quality Improvement Indicators:
-
Defect detection rate by inspector capability level
-
Customer complaint patterns revealing skill deficiencies
-
Compliance violation frequency by regulatory knowledge currency
-
Warranty claims traceable to manufacturing skills
These metrics come from operational systems — ERP, quality management, customer service platforms. The data already exists; it just needs connecting to skills.
Risk Mitigation Measurements
Business Continuity Metrics:
-
Single points of failure from unique skill holders
-
Succession readiness depth for critical roles
-
Cross-training effectiveness in preventing disruption
-
Knowledge transfer success rate during transitions
-
Time-to-competence for emergency role coverage
Compliance and Safety Tracking:
-
Incident frequency by skill verification recency
-
Near-miss patterns indicating training gaps
-
Audit findings linked to capability deficiencies
-
Regulatory change adaptation speed by learning agility
Strategic Capability Indicators
Innovation Metrics:
-
New product introduction rate by R&D skill diversity
-
Patent applications per technical capability investment
-
Process improvement submissions by operational expertise
-
Technology adoption speed by digital skill baseline
-
Competitive advantage duration from unique capabilities
Organizational Agility:
-
Redeployment success rate by skill portfolio breadth
-
Project staffing speed by skill availability
-
Strategic pivot execution by change management capability
-
Market response time by decision-making skills
These items provide a starting point for linking specific capabilities to measurable business outcomes.
Dashboard architecture that actually works
A functional skills dashboard needs three architectural layers that most HR systems lack.
The Evidence Collection Layer
This isn't survey data or training records. It's operational proof that skills exist and create value. Code quality metrics from static analysis tools. Call resolution data from service platforms. Project delivery metrics from management systems. Manufacturing quality data from production systems.
The challenge is normalization. A developer's Git commits, a sales rep's CRM activities, and a warehouse operator's WMS transactions all prove skills differently. The architecture has to translate these diverse signals into comparable skill evidence.
One approach that works: skill inference rules. When a developer's pull requests consistently pass review without major revisions, infer code quality skills. When a customer service rep resolves complex issues without escalation, infer problem-solving abilities. When a project manager delivers on time despite scope changes, infer risk management capabilities.
The Attribution Layer
This connects business outcomes to contributing skills while controlling for other factors. A sales team might hit targets because of great skills, a hot market, or a superior product. The dashboard has to separate skill contribution from environmental factors.
Statistical models help but aren't sufficient on their own. You need business context. A predictive maintenance technician might show poor performance metrics during a plant upgrade — not from skill deficiency but from learning new equipment. The attribution layer has to account for these transitions.
The Prediction Layer
This forecasts future performance based on current skill state. If three senior engineers with cloud architecture skills are approaching retirement and internal training takes 18 months, you're looking at a capability crisis in 12 months.
The prediction layer also identifies skill decay. Technical skills degrade without use. Compliance knowledge becomes outdated. The dashboard has to predict when current capabilities will fall below minimum thresholds before the gap becomes a real operational problem.
The data quality governance checklist
Skills data corrupts faster than any other HR dataset. Without governance, dashboards become fiction within months.
Evidence Freshness Standards
| Skill Category | Maximum Evidence Age |
|---|---|
| Technical skills | 60 days |
| Operational skills | 90 days |
| Leadership capabilities | 180 days |
| Compliance certifications | Per regulatory requirements |
Implement automatic confidence degradation. Every 30 days without fresh evidence, reduce confidence scores by 15–20%. This prevents stale data from influencing decisions.
Verification Requirements
-
Multiple evidence sources for critical skills (minimum 3)
-
Cross-reference self-assessment with operational data
-
Manager ratings validated against team performance
-
Peer assessments weighted by rater credibility
Data Conflict Resolution
-
Operational output (what they actually produce)
-
Peer observation (what colleagues see)
-
Manager assessment (what supervisors observe)
-
Self-reporting (what employees claim)
Audit Protocols
-
Monthly
Verify high-impact skill ratings against recent performance
-
Quarterly
Validate skill-to-outcome correlations
-
Annually
Comprehensive review of inference rules and attribution models
Skipping this governance is where most implementations quietly fall apart — not during the build, but six months after launch when nobody's noticed the data has drifted.
Converting from vanity metrics without organizational chaos
The transition from traditional metrics to outcome-based KPIs typically triggers resistance. People invested years building current dashboards. Managers learned to game existing metrics. Employees know how to look good under current measurement.
Start with parallel running. Keep existing metrics visible while building outcome-based measurements alongside them. This reveals the gaps without immediately threatening anyone. A technology company ran both systems for six months. Traditional metrics showed steady improvement. Outcome metrics showed declining capability in three critical areas. The contrast made the case for change better than any presentation could have.
Pick non-threatening pilots first. Start with skills everyone already agrees need better measurement — customer service resolution capabilities, software deployment quality, manufacturing defect detection. Areas where current metrics obviously aren't working.
Build coalition through insights. When outcome-based metrics reveal that the quiet engineer in the corner has the most critical architectural skills, or that customer satisfaction depends more on product knowledge than personality, stakeholders pay attention. These discoveries change how organizations think about talent — sometimes uncomfortably so.
Phase in accountability gradually. Use new metrics for insight and planning before connecting them to performance reviews or compensation. Let people adjust to being measured differently before adding consequences.
The operational integration that makes it real
Most skills dashboards fail because they exist in isolation from operational systems. They rely on periodic updates, manual assessments, and training data — while actual skill evidence lives in the tools people use every day.
Modern operational software can bridge this gap through API connections and data pipelines that continuously pull evidence from:
-
Development tools (GitHub, Jira, CI/CD pipelines)
-
Customer platforms (Zendesk, Salesforce, Intercom)
-
Project systems (Asana, Monday, MS Project)
-
Quality tools (inspection systems, testing platforms)
-
Financial systems (ERP, accounting, inventory)
Connection alone isn't enough, though. The system needs intelligence to interpret operational data as skill evidence. This is where AI automation becomes genuinely useful — not as a buzzword, but as a practical tool for pattern recognition at a scale humans can't manage manually.
Natural language processing can analyze customer interactions to assess communication effectiveness. Machine learning can identify which code patterns correlate with fewer bugs. Statistical analysis can separate skill contribution from environmental factors. None of that happens with a spreadsheet and a quarterly survey.
The key is starting small. Connect one operational system. Measure one skill through real evidence. Prove the correlation to business outcomes. Then expand.
Early warning systems that prevent skill crises
Predictive analytics transform skills from a reporting function into a strategic capability.
Skill Supply-Demand Forecasting
Map future project requirements against current skill inventory. A pharmaceutical company's dashboard showed they'd need 15 validation engineers with specific regulatory expertise for a new product launch. They had 8, with 3 approaching retirement. Eighteen-month lead time for training. The warning came 24 months before crisis, enabling proactive hiring and development.
Capability Decay Modeling
Track skill degradation patterns. Cloud architecture skills decay roughly 20% annually without active use. Regulatory knowledge becomes risky after 6 months without updates. The dashboard predicts when skills will drop below acceptable thresholds, triggering retraining before problems emerge.
Team Composition Risk Scoring
Analyze skill interdependencies. A data team might have strong Python skills but lack SQL expertise. Individually, everyone looks capable. Together, they can't build production pipelines. The dashboard identifies these composition gaps before projects fail.
Succession Vulnerability Mapping
Identify single points of failure. When only one person has critical skills, the dashboard flags the risk. When that person takes extended leave and performance metrics don't shift noticeably, the skill might not be as critical as assumed — which is useful information too.
ROI measurement that finance actually believes
Traditional training ROI calculations rely on satisfaction scores and completion rates. Outcome-based measurement provides real financial impact.
A distribution company tracked every skill development investment against operational metrics for two years. Results challenged conventional wisdom:
| Investment | Initial Expectation | Actual Outcome |
|---|---|---|
| Leadership training | Improved team productivity | 18% retention gain, zero productivity impact |
| Technical certification | Strong individual output | 8% individual gain, reduced collaboration |
| Cross-training programs | Immediate ROI | Negative short-term, ~3x return after 9 months |
| Soft skills workshops | Broad metric improvement | No measurable impact on any tracked metric |
This analysis completely restructured their development budget. They eliminated programs that felt important but delivered nothing. They doubled down on capabilities that actually moved business metrics.
The calculation methodology matters. Include both direct impacts (productivity gains, error reduction) and indirect effects (improved retention, faster hiring). Account for opportunity costs — time spent in training could have been productive. Consider decay rates — skills that aren't maintained waste the original investment.
Avoiding the predictable failure patterns
Even with good frameworks, implementation fails in predictable ways.
Over-Complexity Paralysis
Organizations define hundreds of skills, build elaborate taxonomies, create overwhelming dashboards. A healthcare system mapped 1,400 distinct nursing competencies. Nobody could track them. Usage dropped to zero within six months. Focus on the 30–50 capabilities that actually drive your critical outcomes.
Under-Investment in Data Quality
Bad data destroys credibility instantly. When a dashboard shows skill gaps that don't exist or misses obvious deficiencies, stakeholders stop trusting it. Better to start with less data of high quality than comprehensive garbage.
Context Blindness
Raw metrics miss environmental factors. A team might show skill gaps but deliver excellent results through superior processes or tools. Another team might have perfect skill scores but fail due to poor leadership or resource constraints. Without context, the dashboard drives wrong decisions.
Gaming Prevention
Once people realize metrics affect their careers, gaming begins. Developers might optimize for metrics that make them look skilled rather than writing good code. Sales reps might pursue easy wins that demonstrate basic skills rather than challenging deals that build advanced capabilities. Design metrics that are hard to game and actually valuable to achieve.
Maintaining momentum beyond implementation
Skills measurement isn't a project with an endpoint — it's an operational capability requiring constant evolution.
Business strategies shift. New technologies emerge. Competitive landscapes change. The skills that drove yesterday's success might cause tomorrow's failure. The dashboard has to evolve continuously or it becomes irrelevant, usually faster than people expect.
Establish quarterly calibration cycles. Review which metrics still predict outcomes. Eliminate those that've drifted into vanity territory. Add new ones as business priorities shift. Build feedback loops between operations and HR — when front-line managers identify performance issues the dashboard missed, investigate why. These gaps reveal measurement blind spots that no amount of internal review will surface.
Create learning systems that improve prediction accuracy over time. Track when the dashboard correctly predicts skill-related issues. Note when it misses. Use those observations to refine attribution models and inference rules.
Organizations that treat skills measurement as strategic infrastructure — not an HR report — develop genuine competitive advantages. They allocate talent more effectively. They develop capabilities more precisely. They predict and prevent skill-related failures before the impact hits the business.
Most importantly, they stop wasting money on development that doesn't matter while investing confidently in capabilities that drive real results. The dashboard stops being about tracking skills and starts being about making better talent decisions — which, when you get it right, is one of the few things in operations that compounds over time.
Ready to elevate your team's skills?
Join 500+ companies using Talioly to boost skill visibility, streamline training, and drive performance growth.