

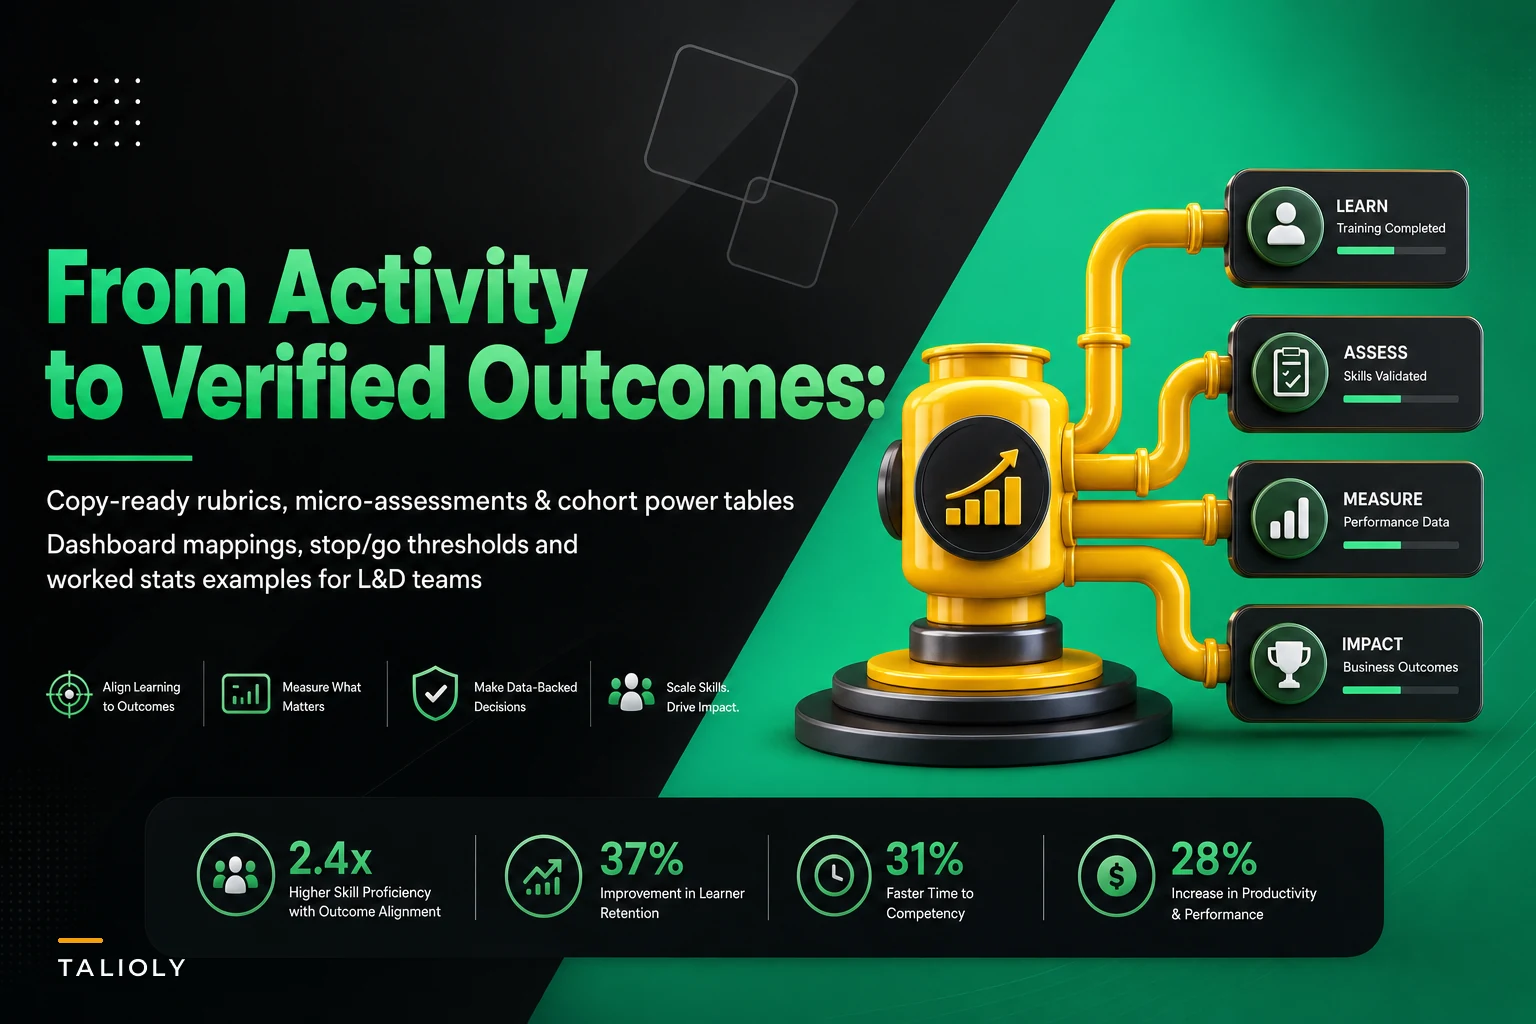

Most L&D measurement dies in the gap between "we ran the pilot" and "here's the number the CFO will sign off on." You have attendance data, maybe a smile-sheet survey, and a manager who swears the team "feels sharper." None of that survives a budget review. The hard part isn't deciding to measure outcomes — it's having the actual artifacts ready: the rubric the reviewer scores against, the assessment items that hold up, the stats table that tells you if your cohort was even big enough to detect anything.
This is the companion piece to the planning side of things. If you've already read how to run a small upskilling pilot that proves ROI, this is the toolkit that fills in the measurement machinery underneath it. Everything here is meant to be copied, adapted to your roles, and dropped into a pilot you're running next quarter — no data scientist required.
Artifact by artifact, here's what you actually need.
Start with scoreable rubrics, not vibes
The most common failure isn't bad measurement — it's measuring the wrong unit. People try to score "communication skills" on a 1–5 scale and end up with three reviewers giving the same call a 2, a 4, and a 5. The scale isn't the problem. Nobody anchored what each number looks like in behavior.
A usable rubric does two things: it names observable behaviors, and it describes what "good" and "not yet" actually sound like. Here are three you can lift directly.
Sales call rubric (scored on a recorded or live call)
| Dimension | 1 — Not yet | 3 — Developing | 5 — Strong |
|---|---|---|---|
| Discovery | Jumps to pitch, asks <2 qualifying questions | Asks surface questions, misses budget/authority | Uncovers need, budget, timeline, and decision process |
| Objection handling | Gets defensive or concedes immediately | Acknowledges but doesn't reframe | Reframes, confirms resolution, moves forward |
| Next-step control | Call ends with "I'll follow up" | Vague next step, no date | Specific committed next step with owner and date |
Score each dimension, then sum. A 15-point call is a different animal from a 7-point call, and two reviewers scoring the same recording should land within a point or two of each other. If they don't, the anchors are too fuzzy — tighten the language before you tighten the reviewers.
Code review rubric (scored on a submitted PR)
-
Correctness (1–5) 1 = logic errors ship; 3 = works but edge cases missed; 5 = handles edge cases, includes tests that actually cover them.
-
Readability (1–5) 1 = needs a verbal walkthrough to understand; 3 = readable with effort; 5 = self-documenting, clear naming, logical structure.
-
Review responsiveness (1–5) 1 = ignores or argues past feedback; 3 = addresses comments literally; 5 = understands the intent behind feedback and improves beyond it.
Support ticket rubric (scored on a closed ticket thread)
-
Diagnosis accuracy (1–5) did they identify the real root cause or just the symptom?
-
Resolution quality (1–5) one-touch fix vs. multiple back-and-forths that could've been avoided.
-
Customer tone (1–5) mechanical/templated vs. clear, warm, and situation-aware.
The pattern across all three: you're scoring artifacts people already produce. Calls get recorded. PRs get merged. Tickets get closed. You're not inventing new work — you're putting a consistent lens on work that already exists. That's what makes this sustainable past month two.
Micro‑assessments: 3–6 items per skill, no more
A full certification exam is overkill for a pilot. You need just enough signal to detect movement. Three to six well-built items per skill does it, as long as they're the right kind of items.
Stop losing track of critical skills.
Talioly helps you track, develop, and certify your workforce efficiently.
- Centralized skill profiles
- Automated training reminders
- Competency gap analysis
No credit card required
Mix three formats:
-
Situational judgment test (SJT) present a realistic scenario, offer four responses, ask for the best and worst. SJTs predict on-the-job behavior far better than knowledge recall.
-
Multiple choice (MCQ) for the genuinely factual stuff — policy, process steps, tool mechanics.
-
Checklist anchors a yes/no "did they do X" list a manager or peer completes while observing real work.
A worked example for a support skill:
-
SJT "A customer is angry about a bug that's actually user error. What's the best first move?" (Options range from correcting them immediately → acknowledging frustration, then clarifying.)
-
MCQ "Which log do you check first for an auth failure?"
-
Checklist anchor "In the last three tickets, did the agent confirm the fix worked before closing? (Y/N each)"
Keep item counts honest. Six items that discriminate between strong and weak performers beats a 40-question bank where everyone scores 85%. If an item has 95% correct responses across your pilot group, it's not telling you anything — retire it.
How big does the cohort need to be?
This is where most pilots quietly cheat. People run 8 people through a program, see the average tick up, and declare victory. With 8 people, random noise alone can move your average by a full point. You need enough participants to trust the signal.
A rough unified table for detecting a pre/post change, assuming 80% power at the standard significance level. Effect size is in standard deviations (Cohen's d):
| Effect you're trying to detect | Approx. cohort size (paired pre/post) | Approx. cohort size (vs. control group, each arm) |
|---|---|---|
| Large (d ≈ 0.8) | ~15 | ~26 |
| Medium (d ≈ 0.5) | ~34 | ~64 |
| Small (d ≈ 0.3) | ~90 | ~175 |
Read it like this: if you only have 15 people, you can only reliably prove a big improvement. A subtle-but-real gain will hide in the noise, and you'll wrongly conclude the program did nothing. That's the trap. Match your ambition to your headcount before you run anything — if the realistic effect is medium and you've got 12 people, you don't have a measurement problem yet, you have a design problem.
The practical move when you're short on participants: use a paired pre/post design where everyone is their own control. It needs far fewer people than a two-group comparison.
A worked pre/post example (with the actual math)
Say you ran a code-review quality program with 30 engineers, scoring merged PRs on the 15-point rubric above.
-
Pre mean 8.4, SD 2.1
-
Post mean 10.9, SD 1.9
-
Mean difference +2.5 points per engineer
For a paired t-test, you need the SD of the differences, not the SD of each period. Say the per-person differences had an SD of 2.8.
-
Standard error = 2.8 / √30 ≈ 0.51
-
t = 2.5 / 0.51 ≈ 4.9
-
With 29 degrees of freedom, that's comfortably significant.
Good — but significant doesn't mean it paid off. For that you need ROI.
The ROI calc
Suppose better code reviews cut rework. Before the program, roughly 18% of PRs needed a second round of fixes; after, about 11%. Across a team shipping ~200 PRs a month, that's roughly 14 fewer rework cycles monthly. If each rework cycle burns around 3 engineer-hours at a loaded rate of ~$75/hr, that's roughly $3,150/month, or close to $38k annualized.
Program cost: facilitator time, materials, and about 6 hours per engineer off regular work. Call it ~$22k all-in for the cohort. Net positive inside the first year, with the benefit compounding as the behavior sticks. That's the number that survives the budget review — not "attendance was 94%."
Difference‑in‑differences, when you have a comparison group
Pre/post alone has a real weakness: maybe everyone got better because a new tool shipped, or the quarter was just calmer. Difference-in-differences (DiD) controls for that by comparing the change in your trained group against the change in an untrained comparison group over the same window.
-
Trained group
went from 8.4 → 10.9 (change of +2.5)
-
Comparison group
went from 8.6 → 9.1 (change of +0.5)
-
DiD estimate 2.5 − 0.5 = +2.0 points attributable to the program
That extra 0.5 the comparison group gained? That's the "something else was happening anyway" effect. DiD strips it out, and your defensible number becomes +2.0, not +2.5. It's a more conservative — and more credible — figure to put in front of finance.
Stop/go thresholds by role criticality
Not every role deserves the same bar. A safety-critical role needs a higher proven lift before you scale the program; a low-stakes role can proceed on thinner evidence. Decide this before you see results, so you're not moving the goalposts to fit the outcome.
| Role criticality | Minimum lift to "go" | Minimum cohort | Stat requirement |
|---|---|---|---|
| Safety / compliance critical | ≥ 1.0 SD, DiD confirmed | 40+ | Significant + control group |
| Revenue-critical (sales, key ops) | ≥ 0.5 SD | 30+ | Significant pre/post, control preferred |
| Standard roles | ≥ 0.3 SD or clear ROI positive | 15+ | Significant pre/post acceptable |
| Low-stakes / exploratory | Directional improvement + positive feedback | any | Descriptive is fine |
Writing these down in advance is the single most honest thing you can do in a pilot. It's also the thing most teams skip — and then they rationalize a weak result into a "go" because they're emotionally invested in the program. Lock the thresholds in the pilot charter before anyone sees a single score.
Dashboard schema and sample queries
Keep the data model boring and flat. A few tables cover almost everything:
-
assessmentsemployeeid,skillid,rubricversion,score,maxscore,assessmenttype(pre/post),assessedat,reviewerid,cohortid -
cohortscohortid,programname,rolecriticality,iscontrol,startdate,enddate -
outcomesemployeeid,metricname(e.g. reworkrate),metricvalue,period
A sample query for pre/post lift by cohort:
SELECT cohortid, assessmenttype, AVG(score) AS meanscore, STDDEV(score) AS sdscore, COUNT(*) AS n FROM assessments WHERE skillid = 'codereview' GROUP BY cohortid, assessmenttype;
And a reviewer-agreement check to catch rubric drift:
SELECT reviewerid, AVG(score) AS avggiven, STDDEV(score) AS spread FROM assessments WHERE cohortid = 'Q2engpilot' GROUP BY reviewerid ORDER BY avg_given;
If one reviewer's average is a point and a half off everyone else's, you've found a calibration issue, not a performance one.
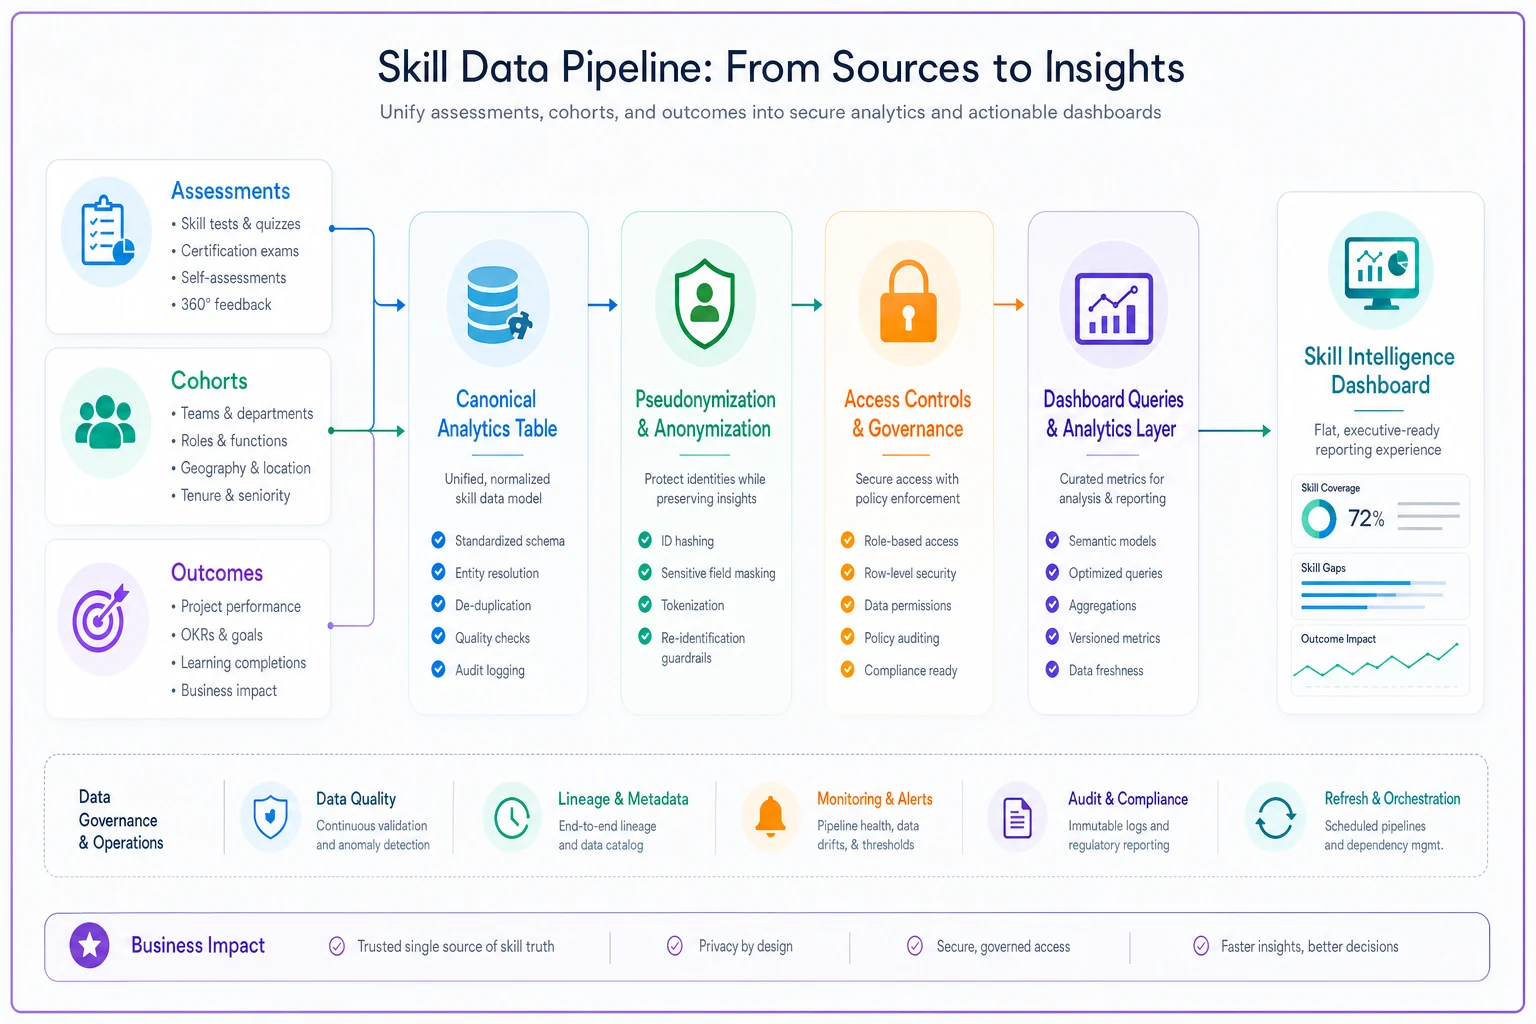
A visual of the pipeline helps stakeholders understand where scores and outcomes connect.
Attrition and confounders: the quiet result-killers
Two things silently wreck pilot numbers.
Attrition bias. Dropouts aren't random — the strugglers often leave first. If you only score the finishers, your post-mean looks great because you quietly removed the bottom of the distribution. The fix: report completion rate alongside results, and run an intent-to-treat analysis where you include everyone who started, using their last known score. If results hold under intent-to-treat, you've got something real.
Confounders. A reorg, a new manager, a tool rollout, seasonality. Any of these can masquerade as program effect. The DiD approach handles the systemic ones. For the rest, keep a simple log of "what else changed during the pilot window" and flag it in your write-up. You don't have to control for everything — you just have to be honest about what you couldn't.
-
- [ ] Completion rate reported, not hidden
-
- [ ] Intent-to-treat analysis run (not just finishers)
-
- [ ] Comparison group drawn from similar roles and workload
-
- [ ] Known events during the window logged
-
- [ ] Reviewer calibration checked
-
- [ ] Thresholds set before seeing data
A short checklist before you trust any result:
Data pipeline mapping and privacy controls
Your assessment scores live in one system, your business outcomes in another, your HRIS in a third. A simple field-mapping discipline keeps it manageable:
| Source | Source field | Canonical field | Notes |
|---|---|---|---|
| Assessment tool | user_email | employee_id | Hash email → stable ID |
| HRIS | emp_number | employee_id | Primary key |
| Business system | agent_login | employee_id | Map via lookup table |
On privacy: assessment scores are sensitive. A few non-negotiables — pseudonymize at ingestion (work off hashed IDs, not names), restrict raw score access to the program owner, aggregate anything shared beyond that group (minimum cell size of around 5 so individuals can't be reverse-identified), and set a retention window so old pilot data doesn't linger.
Loop in whoever owns data governance before you start pulling, not after someone asks an uncomfortable question.
When this full apparatus makes sense — and when it doesn't
Run the whole thing when: the program is expensive, it's going to scale across a lot of people, it touches critical roles, or you need a defensible number for a budget decision. The measurement cost is worth it when the stakes are real.
Scale it down when: you're testing a cheap, low-risk program on a handful of people. A 6-person lunch-and-learn doesn't need a difference-in-differences model. Descriptive results and a quick feedback round are proportionate.
Who should skip it entirely: if you can't get a comparison group and your cohort is under about 15 and the realistic effect is small — you don't have a measurement problem, you have an underpowered study. Redesign before you spend the effort, or you'll generate a confident-looking number that means nothing.
A short remediation playbook (when someone doesn't hit the bar)
Measurement isn't just for proving ROI — it surfaces individuals who need a different path.
Keep the response structured, not punitive:
-
Confirm it's real, not a scoring fluke — re-check against a second reviewer or a fresh artifact.
-
Diagnose the gap category — knowledge, application, or consistency? Each needs a different fix.
-
Assign targeted practice, not a repeat of the whole program. Knowledge gaps get reference material; application gaps get paired work on real tasks.
-
Re-assess on a short loop — 2–3 weeks, same rubric, same items.
-
Escalate to a manager conversation only after two remediation cycles, with evidence in hand.
Keep the response structured, not punitive:
Manager communication scripts
Managers make or break adoption, so hand them the words.
Pre-pilot, to the team: "We're running a short skills program and measuring it properly — before and after, against a clear rubric. This isn't a performance review. The scores help us see if the program works, not to rank you. Your individual results stay between you and me."
Delivering a below-threshold result 1:1: "Your post-assessment came in below where we'd expect for this skill. That's useful information, not a mark against you. Here's the specific gap, and here's a focused two-week plan to close it. We'll re-check at the end."
Reporting cohort results up: "The trained group improved 2.0 points over the comparison group, significant and attributable to the program. That maps to roughly $38k annualized in reduced rework. Recommendation: scale to the next two teams."
The jump from activity metrics to verified outcomes isn't about fancier statistics. It's about deciding, in advance, what counts as proof — then having the rubric, the items, the power table, and the thresholds ready so you're measuring instead of improvising. Every artifact above exists to kill one specific excuse: "we couldn't really tell if it worked." With these in hand, you can tell.
Pick one program next quarter, wire up the pre/post, set your thresholds before you see a single score, and run it clean. The number you get — good or bad — will be worth more than a year of attendance reports.
Ready to elevate your team's skills?
Join 500+ companies using Talioly to boost skill visibility, streamline training, and drive performance growth.