



Most skills programs die in the same room. Not the training room — the boardroom. HR walks in with dashboards showing badge completions, proficiency lifts, and engagement scores. The CFO nods politely, then asks one question: "What does this save us next quarter?" And the room goes quiet.
The problem isn't that skills data lacks value. It's that skill signals and financial artifacts speak two completely different languages. Proficiency levels, competency tiers, verified capabilities — none of that maps to anything a finance team is tracking. They think in cost-of-vacancy, redeployment savings, sensitivity ranges, and marginal spend. If you want a skills ROI model for executives that survives contact with the CFO, you have to translate before you present, not after.
This is a systems problem. The failure happens at the boundary between two functions that measure the world differently. Below is how to build that translation layer — the models, the calculation steps, the decision thresholds, and the slide format that actually gets a yes.
Why skill signals never make it past finance
HR measures capability. Finance measures cash movement and risk. When you hand a CFO a slide saying "42 employees reached advanced proficiency in cloud infrastructure," you've given them a number that doesn't connect to any line they manage.
Most skills teams assume the value is self-evident. It isn't. A CFO's mental model runs on a handful of recurring artifacts:
-
Cost of an unfilled role (per day, per role family)
-
Cost of external hiring vs. internal movement
-
Time-to-productivity and the revenue or delivery gap during ramp
-
Sensitivity — how much the answer changes if assumptions shift
-
A clear decision point
when to keep spending, when to stop
If your skills data doesn't get converted into those five things, it stays a "nice to have." And nice-to-haves are the first thing cut when budgets tighten.
There's also a quieter reason this breaks. Finance teams have been burned by soft HR numbers before — the "$4M in productivity gains" claim that never showed up in any actual account. So they discount HR projections by default. Your job isn't just translation. It's rebuilding credibility with conservative, defensible math.
The core building block: a scenario-based cost-of-vacancy model
Cost of vacancy (CoV) is the anchor artifact. Almost every skills ROI argument eventually routes through it, because redeploying or upskilling internal talent avoids or shortens a vacancy. If you can quantify what a vacancy actually costs, you can quantify what avoiding one is worth.
Stop losing track of critical skills.
Talioly helps you track, develop, and certify your workforce efficiently.
- Centralized skill profiles
- Automated training reminders
- Competency gap analysis
No credit card required
The mistake most people make is pulling a single flat CoV number from some HR benchmark article. Finance doesn't trust flat numbers. They trust scenarios — a range with stated assumptions.
Here's the calculation structure that holds up:
Daily cost of vacancy = (Fully-loaded role value per day) × (Productivity drag factor) + (Coverage cost per day)
Worked example using a mid-level data engineer role:
-
Fully-loaded role value per day. Salary plus benefits and overhead, roughly $145k annually. Divide by ~220 working days ≈ $660/day. But salary isn't the value — the output the role produces is higher. Finance usually accepts a value multiple of 1.3–2.0x for roles tied to delivery. Use a conservative 1.4x → ~$924/day of value at risk.
-
Productivity drag factor. A vacant role rarely means zero output — teammates absorb some load. But that absorption degrades their own output. Estimate the net productive loss at 60% of the role's value while vacant. So ~$924 × 0.6 ≈ $554/day.
-
Coverage cost. Overtime, contractor stopgaps, delayed projects. Say a contractor patch runs about $300/day during the gap.
Daily CoV ≈ $554 + $300 = ~$854/day.
Now the scenario layer. Instead of one time-to-fill number, model three:
| Scenario | Time to fill | Daily CoV | Total vacancy cost |
|---|---|---|---|
| Optimistic | 35 days | $854 | ~$29,900 |
| Expected | 60 days | $854 | ~$51,200 |
| Pessimistic | 95 days | $854 | ~$81,100 |
That table alone changes the conversation. You're no longer saying "vacancies are expensive." You're saying "this role costs us roughly $30k to $81k every time it opens, and here's the assumption band." Finance can work with that.
Here's a visual workflow that shows the steps: calculate fully-loaded daily role value → apply productivity drag → add coverage costs → run scenarios for time-to-fill to produce a vacancy cost band.
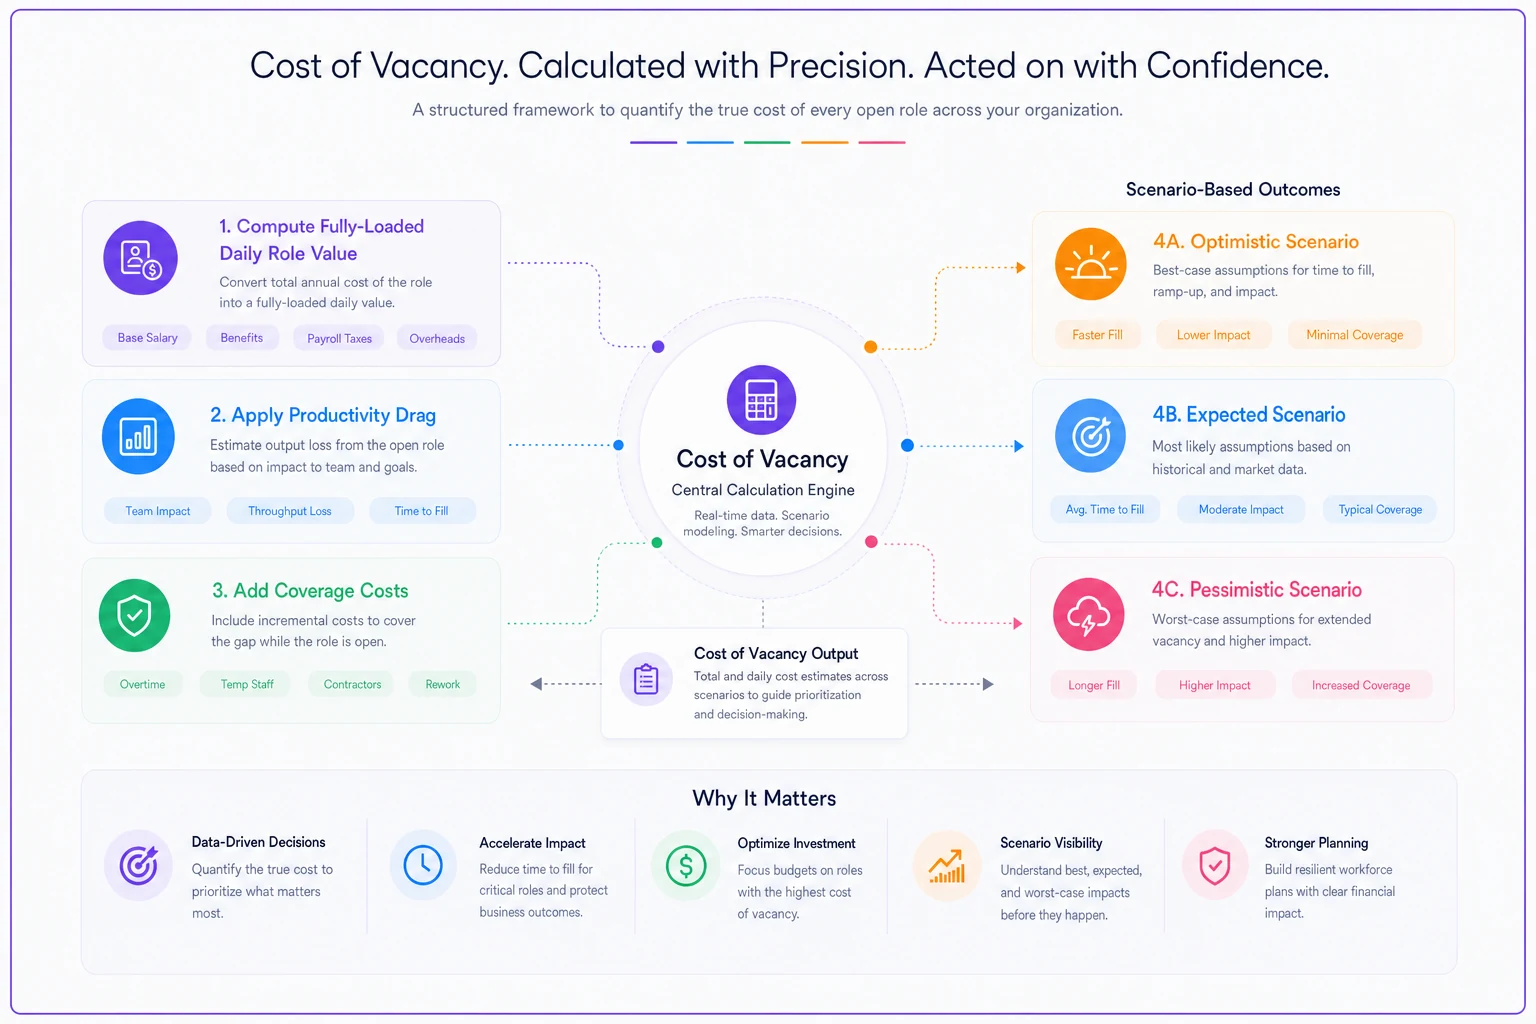
That visual makes it easier to explain the scenario branching during a meeting and keeps the math anchored to concrete steps.
Redeployment savings: the number that actually funds your program
Cost of vacancy tells you the exposure. Redeployment savings tells you what you capture when a verified internal candidate fills a gap instead of an external hire.
The redeployment saving isn't just "we didn't pay a recruiter." It stacks several avoided costs:
-
Avoided external hiring cost — agency fees, sourcing time, sign-on. For technical roles this typically runs 15–25% of first-year salary, so roughly $22k–$36k here.
-
Shortened vacancy — internal candidates are often available in days, not months. If redeployment cuts time-to-fill from 60 days to 15, that's ~45 days × $854 ≈ $38,000 in avoided CoV.
-
Faster ramp — someone already inside the company knows the systems, the people, the context. Time-to-productivity is typically 40–60% shorter than an external hire.
The catch — and this is where most models quietly cheat — is that redeployment isn't free. You have to net out the cost of the backfill for the role the person left, plus any upskilling to close the gap. A redeployment that creates a new vacancy somewhere else hasn't saved anything; it's just moved the problem.
A defensible redeployment saving looks like this:
Net redeployment saving = (Avoided hiring cost + Avoided CoV + Ramp savings) − (Backfill cost + Upskilling cost)
Worked example for one redeployment:
-
Avoided hiring cost
~$28,000
-
Avoided CoV (45 days shorter)
~$38,000
-
Ramp savings
~$9,000
-
Backfill cost (junior role, easier to fill)
−$14,000
-
Upskilling cost (targeted, 3 weeks)
−$6,500
Net saving ≈ $54,500 per redeployment.
Verify internal candidates' skills with a short practical assessment before counting them as redeployable to avoid overstating the saving.
Scale that across, say, 20 redeployments a year and you're looking at a program that plausibly returns north of a million dollars — but only if your skill signals are verified, not self-reported. That verification piece is what makes the model believable, which is why it pairs directly with the work of tying skills to real business outcomes rather than vanity metrics that finance ignores.
Sensitivity tables: how you win the credibility fight
A single point estimate invites attack. The first thing a sharp CFO does is question your assumptions — "what if time-to-fill is faster than you think?" or "60% productivity drag seems high." If you've only got one number, you're on defense, and being on defense looks like you have something to hide.
A sensitivity table flips that dynamic. You show them up front how the answer moves as assumptions change. It signals you've already stress-tested your own case.
Here's a sensitivity table for net redeployment saving, varying two of the shakiest assumptions — productivity drag and time-to-fill delta:
| Productivity drag → | 45% | 60% | 75% |
|---|---|---|---|
| 30-day fill delta | $38k | $43k | $48k |
| 45-day fill delta | $49k | $54.5k | $60k |
| 60-day fill delta | $60k | $67k | $73k |
The value of this isn't precision. It's that even the pessimistic corner of the table is a positive number. When your worst-case cell still shows ~$38k of savings, you've removed the "but what if you're wrong" objection before it's raised.
One practical note: pick the two assumptions your finance partner is most likely to challenge and make those your axes. If you sat down with them for ten minutes beforehand, you'd know exactly which ones. Most HR teams skip that conversation and get ambushed in the meeting instead.
Stop / scale decision thresholds
Finance doesn't just want to know a program works. They want to know the rules by which you'll keep funding it or kill it. A program with no kill criteria reads as a blank check, and blank checks get denied.
Define thresholds before you launch, not after results come in. This is the same discipline behind running a structured upskilling pilot with real stop/go thresholds — you commit to the decision rules while you can still be objective about them.
-
Scale trigger Net saving per redeployment stays above $35k AND redeployment fill rate exceeds 55% of eligible internal moves. → Increase budget.
-
Hold trigger Net saving between $15k–$35k OR fill rate 35–55%. → Maintain spend, fix bottlenecks, re-evaluate next quarter.
-
Stop trigger Net saving under $15k for two consecutive quarters OR fill rate below 35%. → Pause, diagnose, or wind down.
The thresholds do two things at once. They give the CFO confidence you'll self-regulate, and they protect you — because when a program underperforms, you've already agreed on what happens next instead of fighting to keep it alive on goodwill.
The trade-off matrix: hire vs. redeploy vs. outsource
Executives rarely make a yes/no decision on a program. They make a choice between options. When a capability gap opens, there are three real levers: hire externally, redeploy and upskill internally, or outsource. Your slide should frame the decision as a comparison, because that's how they actually think.
Sample trade-off matrix for a specific gap — standing up a data-quality function:
| Factor | Hire externally | Redeploy + upskill | Outsource |
|---|---|---|---|
| Upfront cost | ~$32k (hiring) | ~$8k (upskilling) | ~$0 |
| Ongoing annual cost | ~$150k | ~$135k | ~$180k |
| Time to productive | 60–95 days | 15–30 days | 10–20 days |
| Capability retained in-house | Yes | Yes | No |
| Vacancy risk elsewhere | None | Creates backfill need | None |
| Best when | Skill is scarce internally | Adjacent skills exist internally | Need is temporary or spiky |
No single option wins every row. Outsourcing is fastest and cheapest upfront but builds no lasting capability and costs the most over time. Redeploying is cheapest to run and keeps knowledge inside, but creates a backfill problem you have to solve. External hiring builds capability but is slow and expensive to start.
Presenting it this way does something important: it positions HR as a function weighing real options, not a cost center begging for training dollars. That reframe matters more than any individual number on the slide.
When this model actually makes sense
This level of financial modeling is worth building when:
-
You're asking for meaningful, recurring budget — not a one-off pilot.
-
Your skill data is verified and reasonably current, so the redeployment counts are real.
-
You have a finance partner who'll engage with assumptions rather than rubber-stamp.
-
Roles in your organization have adjacencies — meaning redeployment is genuinely possible.
You're asking for meaningful, recurring budget — not a one-off pilot.
When it's a bad idea
Don't force this if your skill data is mostly self-reported and stale. A CoV-to-redeployment model built on unverified profiles will produce numbers that collapse the moment finance audits one case. You'll lose more credibility than you gain.
It's also overkill for small experiments. If you're spending $12k on a targeted pilot, a full scenario-based model with sensitivity tables is theater. Match the rigor to the size of the ask.
-
Don't use this approach when your skill data is unverified or stale.
-
Avoid for small, low-cost experiments where the overhead of modeling outweighs the ask.
-
If your organization has almost no internal adjacency — every role requires deeply specialized outside expertise — the redeployment lever barely exists.
And if your organization has almost no internal adjacency — every role requires deeply specialized outside expertise — the redeployment lever barely exists, and this whole framework loses its center of gravity.
A real scenario
A regional insurance operations group — around 900 employees — kept losing claims-analytics roles to a tight external market. Average time-to-fill sat near 70 days, and they were paying agency fees on nearly every hire.
The HR team mapped verified internal skills and found roughly a dozen people in adjacent underwriting-support roles with 70–80% of the required capability. Instead of pitching "an upskilling program," they built a scenario CoV model showing each unfilled analytics role was costing about $58k in the expected case. They modeled 8 redeployments over the year, netted out backfill and roughly three weeks of upskilling each, and landed on a net saving band of $46k–$61k per move.
The sensitivity table's worst-case corner still showed ~$41k. The CFO approved the budget in one meeting — reportedly the first time the skills team had ever gotten a same-meeting yes. Over the following three quarters they completed 7 of the 8 planned moves, and average analytics time-to-fill dropped from ~70 days to under 25 for internally-filled roles.
The interesting part wasn't the savings figure. It was that finance started pulling the skills team into workforce planning conversations, because HR had finally shown up speaking their language.
The executive slide template
Keep the deck to one primary decision slide, with the models as backup. The structure that works:
-
The gap — one line. What capability is missing and why it matters now.
-
The three options — the trade-off matrix, unchanged from above.
-
The recommendation — your pick, with the net saving band, not a single number.
-
The sensitivity view — the two-axis table showing even the downside is acceptable.
-
The decision rule — your stop/hold/scale thresholds, so they know how you'll govern it.
Everything else — the full CoV derivation, the assumption log, the per-role math — goes in an appendix you only open if asked. Executives want the decision on one slide and the proof available on demand. Leading with the math buries the point.
Bringing it together
Skills programs don't struggle for funding because they lack value. They struggle because the value never gets translated into the artifacts finance is built to evaluate. Cost of vacancy, redeployment savings, sensitivity bands, decision thresholds, a clean trade-off matrix — these aren't finance decoration bolted onto an HR pitch. They're the actual interface between what your team knows about people and what your CFO controls about money.
Build that interface once, with conservative assumptions and stress-tested ranges, and you stop being the function that asks for budget. You become the function that shows executives how to spend it more intelligently.
Skills programs don't struggle for funding because they lack value. They struggle because the value never gets translated into the artifacts finance is built to evaluate. Cost of vacancy, redeployment savings, sensitivity bands, decision thresholds, a clean trade-off matrix — these aren't finance decoration bolted onto an HR pitch. They're the actual interface between what your team knows about people and what your CFO controls about money.
Build that interface once, with conservative assumptions and stress-tested ranges, and you stop being the function that asks for budget. You become the function that shows executives how to spend it more intelligently.
Ready to elevate your team's skills?
Join 500+ companies using Talioly to boost skill visibility, streamline training, and drive performance growth.