

Most HR teams don't fail at validation because the math is hard. They fail because nobody told them which three numbers actually matter — and which twenty they can safely ignore. So they either skip validation entirely ("the vendor said it's validated") or they get paralyzed waiting for a data scientist who never gets assigned to the project.
This is a working primer. No p-value theology, no regression tables. Just the handful of checks you need to answer one question honestly: does this assessment, pilot, or intervention actually predict or cause the thing we care about — or are we fooling ourselves?
If you want the deeper "does this micro-assessment predict on-the-job performance" angle, there's a companion piece on micro-assessments that actually predict on-the-job competency. This post is about the validation mechanics underneath any of that.
The three questions that cover 90% of HR validation
Before any calculator or design, get clear on which question you're actually asking. Teams mix these up constantly, and that's usually where bad decisions start.
| Question | What you're testing | Right tool |
|---|---|---|
| "Does this score predict outcomes?" | An assessment vs. later performance | Cohort correlation |
| "Does this intervention cause improvement?" | A pilot vs. no pilot | A/B (control group) |
| "Did this thing move the needle enough to scale?" | Lift vs. a decision threshold | Effect size + cost |
The most common mistake: teams run a cohort study — people who took the training did better later — and then claim the training caused the improvement. That's a prediction claim dressed up as causation. The people who volunteered for training were probably more motivated to begin with. More on that confound later, because it's the one that quietly ruins most HR pilots.
Pilot sizing: how many people do you actually need?
The single most useful thing you can do before running anything is a rough sample-size estimate. Too small and your result is noise. Too large and you've burned budget and goodwill on something you didn't need.
Stop losing track of critical skills.
Talioly helps you track, develop, and certify your workforce efficiently.
- Centralized skill profiles
- Automated training reminders
- Competency gap analysis
No credit card required
-
The baseline rate of whatever you're measuring (e.g., 60% of new hires hit their 90-day ramp target).
-
The improvement you'd care about — the minimum lift worth acting on (e.g., you'd only scale if it pushes ramp success to 75%).
-
Your tolerance for being wrong — standard defaults are fine here.
If your baseline data looks noisy, cleaning it first can materially shrink your sample-size needs.
A simple rule-of-thumb calculator
> n ≈ 16 × p × (1 − p) ÷ (difference)² where p is your baseline rate as a decimal and difference is the improvement you want to detect.
-
p × (1 − p) = 0.60 × 0.40 = 0.24
-
difference² = 0.15 × 0.15 = 0.0225
-
n ≈ 16 × 0.24 ÷ 0.0225 ≈ 171 per group
So you'd want roughly 170 in your pilot group and 170 in your control. That number is often a splash of cold water. A lot of HR "pilots" run with 12 people and then announce a 20% improvement. With 12 people, a 20-point swing is well within pure randomness.
For continuous outcomes (scores, hours, ratings)
> n ≈ 16 × (standard deviation ÷ difference you care about)² per group
-
(12 ÷ 6)² = 4
-
n ≈ 16 × 4 = 64 per group
Smaller variability lets you get away with smaller groups. That's why cleaning up messy baseline data before a pilot is worth the effort — noisy inputs inflate your sample requirements.
The simplest valid A/B design HR can actually run
Forget randomized-controlled-trial purity for a second. Here's a version that survives contact with a real org:
-
Define one primary outcome before you start. Write it down. "90-day ramp target hit (yes/no)" — one metric. Not five. If you pick your winning metric after seeing results, you've cheated, even if unintentionally.
-
Split people into pilot and control by something arbitrary, like employee ID even/odd or alphabetical — not by manager choice or volunteering. Manager choice is where selection bias sneaks in.
-
Keep everything else the same between groups during the pilot window.
-
Measure both groups at the same time, using the same definition.
-
Compare, then apply your decision threshold (below).
The step everyone skips is #2. When managers pick who goes into the pilot, they pick their strongest people, and your "intervention" looks great for reasons that have nothing to do with the intervention.
If you genuinely can't withhold the program from anyone, use a staggered rollout — group A gets it in month 1, group B in month 3. Group B acts as the control for the first two months. This is politically easier ("everyone gets it eventually") and still gives you a clean comparison window.
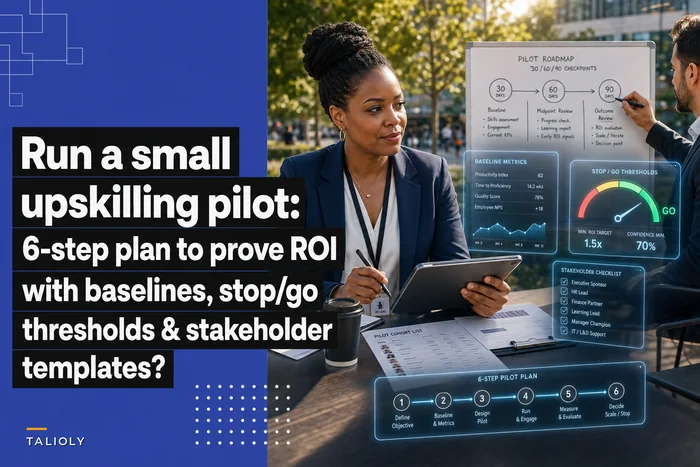
There's a full walkthrough of running this kind of pilot end-to-end, with baselines and stop/go gates, in the piece on running a small upskilling pilot that proves ROI. Pair it with the sizing math above and you've got most of what a data scientist would hand you anyway.
Cohort designs when you can't run a control group
Sometimes you can't randomize — the training already happened, or it's mandatory. Cohort analysis is your fallback. You compare groups that differ on the thing you're studying and track outcomes over time.
A typical example: you want to know if a certification predicts fewer quality escalations. You take everyone certified in Q1 and everyone not certified, then track escalations over the next two quarters.
The trap: certified people might just be your more experienced staff. Before you believe the result, you check confounders. A cohort finding without a confounder check is basically a rumor with a chart attached.
One practical move that strengthens cohort work: match roughly on the obvious confounders. If tenure matters, compare certified vs. uncertified within the same tenure band (0–2 years, 2–5 years, etc.). If the certified group still wins inside each band, your finding holds a lot more weight.
The confounder checks that matter (and how to run them)
A confounder is anything that affects your outcome and differs between your groups. Three checks catch most of them:
-
Baseline balance check. Before the pilot, are the two groups similar on the things that predict your outcome — tenure, prior performance, role, manager? If the pilot group averages 4 years of tenure and control averages 1.5, that gap alone could explain your whole result.
-
The "who opted in" check. If participation was voluntary in any way, motivation is confounded with your intervention. You usually can't fully fix this after the fact — you can only flag it and downgrade your confidence.
-
The timing check. Did anything else change during the pilot window — a reorg, a busy season, a new manager? A hire ramping in December looks nothing like one ramping in July.
A quick, honest way to report this: list every plausible confounder in a table, mark whether your two groups were balanced on it, and note what you did about any imbalance. If half the rows say "not balanced, couldn't fix," your result is directional at best. That's not failure — it's accurate labeling, and it keeps you from overselling to leadership.
Decision thresholds: turning results into go / no-go
Statistical significance is not the same as "worth doing." You need a threshold tied to cost and consequence before you look at results.
Set two thresholds up front:
-
Minimum meaningful lift — the smallest improvement that justifies scaling, based on cost. If a program costs around $400 per person and only pays off above a 10-point ramp improvement, then 10 points is your floor. A statistically real 3-point lift is still a no-go.
-
Confidence bar — how sure do you need to be? For a low-risk, low-cost program, "the pilot group did better and confounders looked clean" is often enough. For a high-stakes hiring assessment, you want the result to hold across cohorts and time windows before rolling it out.
A clean way to think about it:
| Result | Confounders clean? | Decision |
|---|---|---|
| Lift above threshold | Yes | Scale it |
| Lift above threshold | No / unknown | Re-run with better controls |
| Lift below threshold | Yes | Kill or redesign |
| Lift below threshold | No | Inconclusive — don't claim either way |
That bottom-right cell is where most teams go wrong. A messy pilot that showed no improvement gets reported as "the program doesn't work," when the honest answer is "we can't tell." Killing a program on bad evidence is just as costly as scaling one on bad evidence.
A real scenario, with numbers
A mid-sized logistics company (around 600 employees) wanted to know if a new onboarding assessment predicted which warehouse leads would still be in role after six months. Turnover in that role ran close to 35% annually, and each replacement cost roughly $4k–$5k in hiring and lost productivity.
-
Pulled assessment scores for about 140 leads hired over the prior year (a cohort study, since the assessment was already live).
-
Split into high scorers and low scorers.
-
Checked confounders
tenure at hire, prior warehouse experience, and hiring manager. Prior experience was imbalanced — high scorers had more of it — so they matched within experience bands.
Even after matching, high scorers stayed at a noticeably better rate — somewhere around a 12–15 point difference in six-month retention. Against their threshold (they'd decided anything above 8 points was worth acting on), that cleared the bar.
The outcome wasn't dramatic. They didn't rebuild everything. They started using the assessment as one input in hiring decisions and flagged low scorers for extra early support rather than screening them out entirely. Over the following two quarters, six-month retention in the role improved by roughly 9 points — modest, but across 600 employees with $4k–$5k replacement costs, it paid for the whole exercise several times over.
The point isn't the size of the win. It's that they made a defensible decision from data they already had, in a couple of weeks, without a specialist.
When this makes sense — and when to skip it
Do the full validation when:
-
The decision is expensive or hard to reverse (hiring screens, promotion gates).
-
You're about to scale a program org-wide based on a pilot.
-
Leadership is skeptical and you need something more solid than a good feeling.
Skip the heavy stats when:
-
The intervention is cheap, low-risk, and easy to reverse. Running a 170-person controlled trial to validate a $12 lunch-and-learn is a waste of everyone's time. Just try it and watch.
-
Your sample is genuinely tiny (under around 20) and can't grow. Do a qualitative read instead and be upfront that it's qualitative.
Who should NOT do this: anyone who's already decided the answer and is looking for numbers to back it up. Validation only has value if you're willing to act on a result you didn't want. If the program is politically locked in regardless, don't bother dressing it up as evidence-based — that's how HR analytics loses credibility internally.
Where good tooling quietly helps
None of this requires special software — a spreadsheet handles all the math above. Where teams actually get stuck isn't the calculation, it's getting clean, comparable data for both groups in the first place. Pulling matched cohorts, keeping outcome definitions consistent, and making sure your baseline numbers aren't stale — that's usually the real bottleneck.
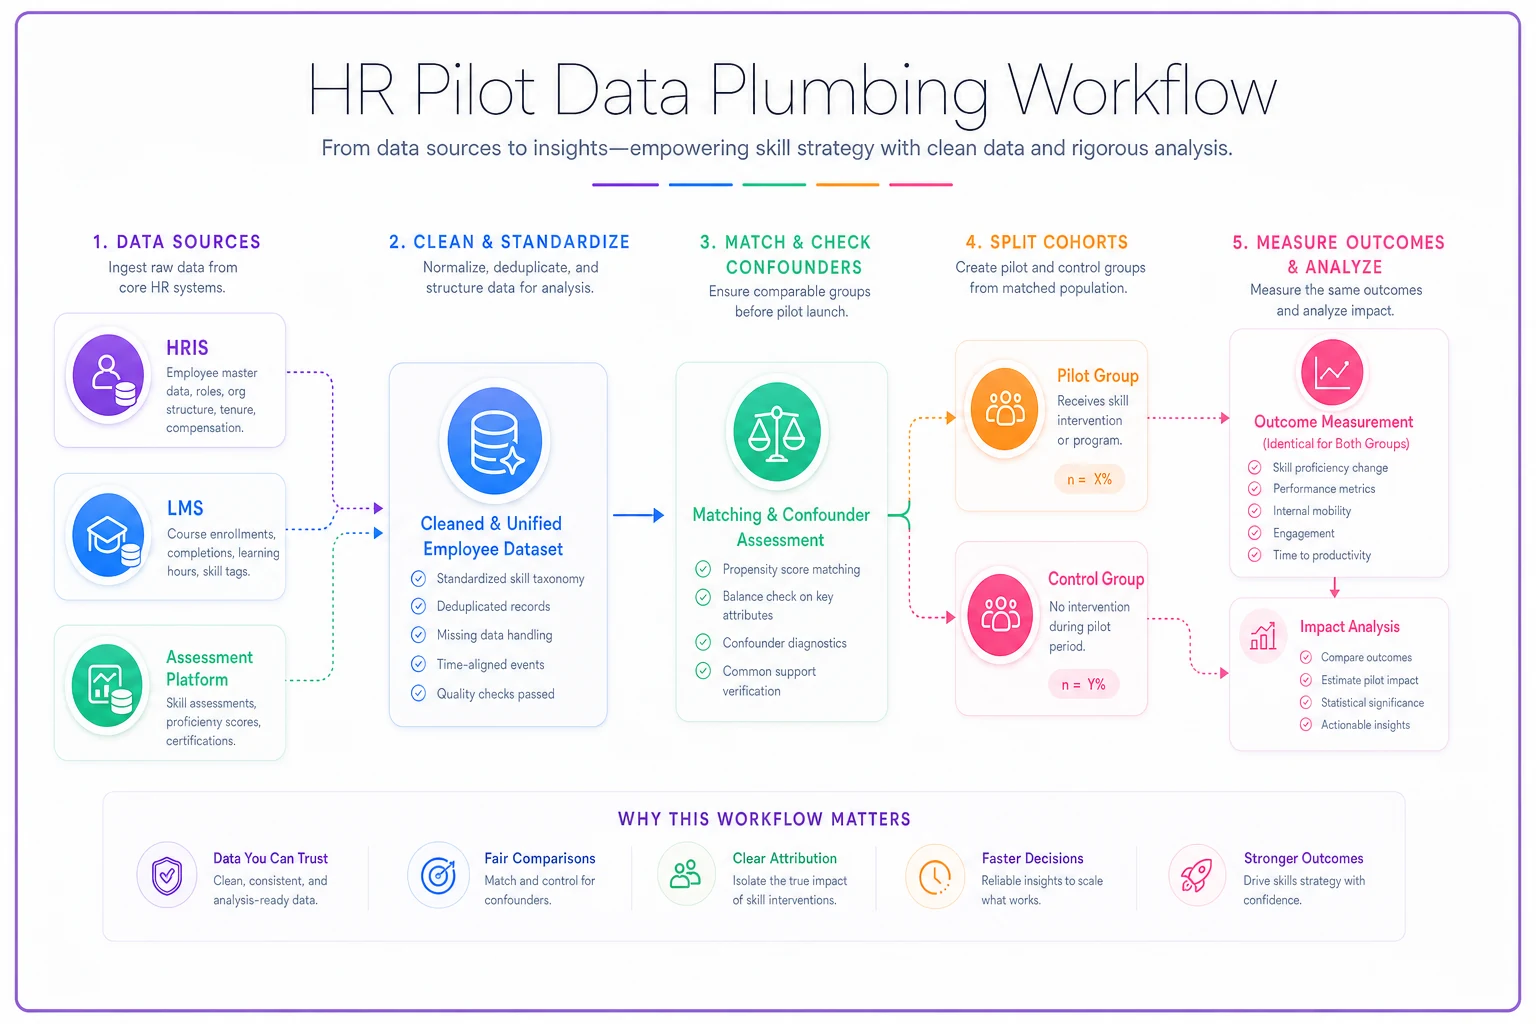
That's the part worth investing in. A workflow platform that keeps skill profiles, assessment scores, and outcome data connected and current means your pilot inputs are trustworthy before you ever open a calculator. AI-assisted checks can flag when two comparison groups look imbalanced on tenure or role, or when a data field is too outdated to rely on — the confounder work you'd otherwise do by hand. The stats stay simple. The data plumbing is where the leverage is.
Bottom line
You don't need a PhD to validate an HR assessment or pilot. You need to know which question you're asking, size your group honestly, split it without letting managers cherry-pick, check the two or three confounders that could explain your result, and set your go/no-go threshold before you look at the numbers. Do those five things and you'll be ahead of most teams three times your size — and you'll stop killing good programs and scaling bad ones on gut feel dressed up as data.
Ready to elevate your team's skills?
Join 500+ companies using Talioly to boost skill visibility, streamline training, and drive performance growth.